We specialize in Artificial Intelligence

We specialize in Artificial Intelligence


Artificial Intelligence Research by ATEM
Atem is a specialized company in artificial intelligence research, supercomputing and robotics.
Our investigations are conducted without a defined purpose, with the aim of developing new tools and mathematical resources that strengthen our artificial intelligence system and enable us to solve complex problems.
As a result of this business model, some of our investigations end in a vertical product, applied to different sectors
Our company has applied its capacity for innovation in other sectors such as: aeronautics, airport systems, trade market, new technologies, environment, genomics, biocomputation, cybersecurity, Artificial Vision, etc.
Our Research in AI allows us to be the owner of Intellectual property rights that all our tecnology includes patents, copyrights, industrial design rights, trademarks, plant variety rights, trade dress, and in some jurisdictions trade secrets.

Located in Salamanca´s Plaza Mayor
ATEM Headquarters is located in The Plaza Mayor of Salamanca, Spain. It is a large public square located in the center of Salamanca.
In 1988, UNESCO declared the old city of Salamanca a World Heritage Site. Today, there is a plaque placed in the center of the plaza marking its significance to boast the plaza's baroque-style beauty.
Our Technological lab is provided with Mac, Linux and Windows, computers. We have a wide range of technology facilities including Advanced Video, Audio, 2D & 3D Modeling & Animation, RFID analyzer, Research software and hardware.
We have a main workroom, office and meeting rooms, rest area, technological laboratory and supercomputing room.
HPC System
CPU Cores

GPU Cores
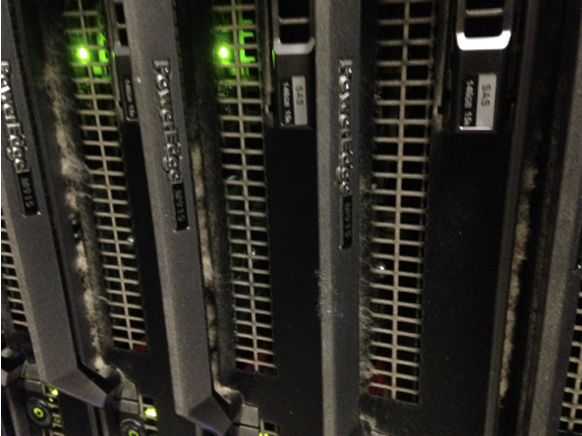
We have a type of multi core processor with sixteen independent actual processing "cores", which are the units that read and execute program instructions. The multiple cores can run multiple instructions at the same time, increasing overall speed for programs amenable to parallel computing.
We also have GPU ACCELERATED COMPUTING. GPU-accelerated computing is the use of graphics processing unit (GPU) together with a CPU to accelerate scientific, analytics, engineering, consumer, and enterprise applications.

Hyperborea Framework. Modules and Models
It is a framework to build Complex Adaptative Systems, created by Atem Nuevas Tecnologías.

•They are complex in that they are dynamic networks of interactions, and their relationships are not added of the individual static entities.
•They are adaptive; in that the individual and collective behavior mutate and self-organize corresponding to the change-initiating micro-event or collection of events.
•They are computerized systems composed of multiple interacting intelligent agents within an environment.
•They are systems able to respond to environmental changes or changes in the interacting parts.
•Hyperborea emphasizes separating the functionality of the built system into independent, interchangeable modules, such that each contains everything necessary to execute only one aspect of the desired functionality.

Types of Hyperborea Modules
• Input Modules
•Processing and Intelligent Modules
•Output Modules

•Extract raw data of its environment.
•Prepare the raw data extracted to be processed by the ‘Processing/Intelligent’ Modules.
•Mainly convert raw data into structured data via filtering and intelligent selection.

•These Modules process the structured data given by the Input Modules.
•The processing modules identify the key concepts inside the structured data in order to be able to build an adaptive intelligent model and prepare the selected structured data to be modeled.
•The intelligent modules are responsible to build the complex adaptive model and to optimize it.
•The built complex adaptive model finally is deployed for its use as the Output modules.
•All these modules form the Artificial Intelligence Core of Hyperborea: IRIPHO
•Composed mainly by User interfaces and actuators.
•They execute the decisions or show the conclusions given by the built Complex adaptive system.
•They are linked with the Input Modules forming a ‘Feedback cycle’.
•The actuators are able to interact with its environment.
Types of Hyperborea Modules
• Once the Complex Adaptive system is built the feedback cycle begins.
•The output modules show the decisions/conclusions of the built model to the environment via mainly user interface and interactue with this environment via actuators.
•The input modules collect and structure the answer of the environment to these actuations and deploy it to the Processing/Intelligent Modules.
•The Processing/Intelligent Modules apply/rebuild/optimize the built Complex adaptive system to adapt it to the new state of the environment.
•The conclusions/decisions of the built Complex adaptive system are delivered to the Output modules and the Feedback Cycle begins again.


Input Modules Reference
•Habot is a Virtual Bot to extract, select, filter and structure raw data. It is the principal Input Module of Hyperborea.
•It can work with data from databases, from the Web, or directly with data from some digital electronic medium such as documents and images.
•It has two main components: A filter engine and a crawling engine.

• The Filter engine permits Habot to filter the data that it will extract and structure.
• With Filter Engine, Habot can easily identify the source of information relevant to the problem being dealt with, and ignoring irrelevant data, converting ‘Big Data’ into ‘Small Data’ (or smaller data).
• The filter process saves time and resources.

• The Crawling engine permits Habot to extract raw data from digital mediums such as Web data, Audio Data, Image data… and structure it in order to prepare for its processing.
• Includes various programs for parsing computer equipment with for example: HTML, XML, JSON or user-defined parsers, to structure the data.
• Supports the use of APIs for data extraction such as Web services APIs
• It can access, extract and structure data from Social Networks like Twitter, Facebook or LinkedIn
• It structures all the relevant data on datasets for posterior processing.
• The extracted data can be classified on distinct datasets of function of the sources, the structure, type or the semantic content of the data.
• It can handle Web sessions, cookie management and it has an OCR system to captcha handling.
The processing modules identify the key concepts inside the structured data in order to be able to build an adaptive intelligent model and prepare the selected structured data to be modeled.
Mainly there are two types of processing modules: Exploration modules and Modeling preparing modules.
•Identify the key concepts inside the structured data in order to be able to build an adaptive intelligent model.
•Identify the completeness and quality of the data to check if it is possible to build a good model with it.
•Next, we detail each exploration module.


• This module includes tecniques for the statistical analysis of the data.
•This includes the following Statistical Moments: Expectation, mean, central moments as variance or covariance’s matrix, raw moments, moments of linear transformations of random variables and moment generation functions.
•Quantiles and interquantile range.
•Correlation analysis.
• Estimation of the probability density functions that follow the data. This includes estimations of the parameters of each pdf identified.
• Classical point parameter estimation: Maximum likelihood estimation, analysis of properties of estimators: bias, efficancy, MSE, Asymptotic bias and variance, consistency and sufficiency.
• Classical Statistical Testing: Hypothesis Tests, Non-Parametric Hypothesis Tests, Confidence Intervals and other tests based on the likelihood.
• Classical Asymptotic Theory: Convergence in mean square, convergence in probability, convergence in distribution.
• Analysis of Variance, Analysis of Covariance, and Distributional Measures: Anderson-Darling Test, Chi-Square Goodness-of-Fit Test and Kolmogorov-Smirnov Goodness-of-Fit Test.
• Bayesian point estimation: Loss functions and minimising the expected loss.
• Bayesian interval estimation: Fixed coverage HPD intervals and fixed with HPD intervals.
• Bayes factors for model comparison.
• Non-parametric methods: Sign test, Wilcoxon signed rank test, Mann-Whitney-Wilcoxon Test, Kruskal-Wallis Test.
• Measures of Skewness and Kurtosis.
• Statistical graphical tecniques for exploration: Boxplots, Scatterplots, Histograms, Correlation graphs, pdf plots, cdf plots, star plots, Weibull plots, Youden plots, parallel plots.
• Identification of observations that appear to deviate markedly from other observations in the sample.
• Important because an outlier may indicate bad data, may be due to random variation or may indicate something scientifically interesting.
• Outlier detection classical tecniques: Grubbs' Test, Tietjen-Moore Test, Generalized Extreme Studentized Deviate (ESD) Test.
• Outlier detection by clustering methods, and machine learning tecniques.
• Outlier detection by Statistical Methods.
• Outlier detection by Proximity-Based Metods.

• Simulating a probability distribution involves generating a sample from the distribution of interest, and then analysing the sample to learn about the distribution which generated the sample.
• Stochastic simulation is simply an example of using a sample to learn about the distribution of the population from which the sample was taken.
• This module includes:
• Markov chain Monte Carlo: sampling from probability distributions based on constructing a Markov chain that has the desired distribution as its equilibrium distribution.
• MCMC methods implemented: Metropolis–Hastings algorithm, Gibbs Sampling, Slice sampling, Multiple-try Metropolis, Hybrid Monte-Carlo.
• Other tecniques: Numerical Integration, Stochastic Differential Equations, Gaussian Processes and Lévy Processes.
• Tecniques for dealing with MCMC samples: Reducing and accounting for dependence. Convergence analysis to target the distribution.
• Zoom and pan around the image.
• Examine a region of pixels.
• Place and manipulate ROIs, including points, lines, rectangles, polygons, ellipses, and freehand shapes.
• You can also interactively crop, adjust the contrast, and measure distances.
• Statistical graphical tecniques for exploration: Boxplots, Scatterplots, Histograms, Correlation graphs, pdf plots, cdf plots, star plots, Weibull plots, Youden plots, parallel plots.


• Image Enhancement as histogram equalization, decorrelation stretching, remap the dynamic range, adjust the gamma value or perform linear, median, or adaptive filtering.
• Image transforms such as FFT and DCT, Radon and fan-beam projections…
• Image Deblurring.


• Edge-Detection: Sobel, Prewitt, Roberts, Canny, and Laplacian of Gaussian methods.
• Image Segmentation as automatic thresholding, color-based methods, edge-based methods, and morphology-based methods.
• Morphological Operators: Erosion and dilation, opening and closing, labeling of connected components, watershed segmentation, reconstruction, distance transform.
• Advanced image analysis functions as measure the properties of a specified image region, such as the area, center of mass, or bounding box, detect lines and extract line segments from an image using the Hough transform or measure properties, such as surface roughness or color variation, using texture analysis functions.
• The Statistical Exploration Module described before can be also used to analyzing images.
• Geometric transformations: useful for tasks such as rotating an image, reducing its resolution, correcting geometric distortions, and performing image registration. Includes simple operations, such as resizing, rotating, and cropping, as well as more complex 2D geometric transformations, such as affine and projective.

• Image registration: Important in remote sensing, medical imaging, and other applications where images must be aligned to enable quantitative analysis or qualitative comparison. Includes intensity-based image registration, control-point image registration and also via models automatically aligns images using feature detection, extraction, and matching followed by geometric transformation estimation.

• Prepare, clean and select the structured data to be modeled.
• Reduce the size of the structure data in order to be able to compute with it.
• Show the models, results, inferences and predictions of the modelling process.
• Are linked to input modules.
• User Interfaces: User applications, Web Interfaces, Mobile Interfaces.
• Database Connected Outputs.
• Formatted Output: XML, HTML, SQL, Dataset different formats…
• Syrma: Language for give instructions to autonomus machines for automatic tasks.
• Robotic Output: Instructions for some robotic agent.
They are the core of our Artificial Intelligence Research System IRIPHO.
• These modules generate intelligent and super optimal models which control the basic behaviour of the built Adaptive Complex system.
• Varius Model Modules can form part of the same Adaptive Complex System.
• These modules are the main focus of our research.

• Algorithm Models.
• Learning/Adaptive Models
• Optimization Models
Models Reference
• Good for environments that are deterministic, observable, static, and completely known.
• A problem consists of five parts: the initial state, a set of actions, a transition model, a goal test function and a path cost function.
• Bread-first search.
• Uniform-cost search.
• Depth-first search.
• Iterative deepening search (depth limit).
• Bidirectional Search.
• Best-first search.
• Greedy best-first search.
• A* search.
• Recursive best-first search.
• Simplified memory bounded A*.

• Defined by an initial state, legal action in each state, the result of each action, a terminal test and a utility function that applies to terminal states.
• Minimax algorithm for two adversaries.
• Alpha-Beta search algorithm.
• Solve Constraint satisfaction problems that represent a state with a set of variable/value pairs and represent the conditions for a solution by a set of contraints on the variables.
• Analysis of consistency: node, arc, path and k-consistency.
• Backtracking search.
• Minimum-remaining-values and degree heuristics.
• Min-conflicts heuristic.
• Cutset conditioning and tree decomposition.
• Knowledge is contained in the form of sentences in a knoledge representation language that are stored in a knowledge base.
• A Logic agent is composed of a knowledge base and an inference mechanism.
• A representation language is defined by its syntax and its semantics.

• It is a simple language consisting of proposition symbols and logic connectives.
• Inference rules.
• Local search methods such as WalkSAT.
• Logical state estimation.
• Decisions via SAT solving.
• The sysntax of first-order logic builds on that of propositional logic. It adds terms to represent objects, and has universal and existential quantifiers.
• Inference rules.
• Unification.
• Generalized Modus Ponens: Foward-chaining and backward-chaining algorithms.
• Demodulation, paramodulation.
• Provide a framework that allows you to numerically encode linguistic expressions and through that gives you a flexible rule-based system.
• Fuzzyfication, Rule evaluation, Aggregation, Defuzzyfication.
• Semantic Networks
• Description logics.
• Nonmonotonic logics.
• Truth maintenance systems.

Models Reference
• These models aren’t programmed explicitely, they learn from the data.
• They improve its perfomance over the time if the new data obtained ‘today’ complements the data obtained ‘yesterday’.
• These models can automodify and reprogram theirself.
Forms of Learning:
The model observes some example input-outpu pairs and learns a function that maps from input to output.
The model learns patterns in the input even though no explicit feedback is supplied.
The model learns from a series of reinforcements – rewards or punishments.
Models Reference
• Flowchart-like tree sructure, where each internal node denotes a test on an attribute, each branch represents an outvome of the test, and ecah leaf node hold a class label.
• Good for classification problems.
• ID3, C4.5 and CART algorithms.
• Support Custom attribute Selection Measures: Information gain, gain ratio, Gini index, MDL.
• Support Pruning methods for prepruning and postpruning: Cost complexity, pessimistic pruning.
• They are statistical classifiers.
• They can predict class membership probabilities.
• Naive Bayesian Classification: Assume class-conditional independence.
• The learned model is represented as a set of IF-THEN rules.
• Can be extracted from a Decision Tree.
• Support rule induction using a sequential covering algorithm.
• They implement Rule Quality Measures and Rule Pruning Tecniques.
• An esemble combines a series of k learned models (or base classifiers), with the aim of greating an improved composite classification model.
• Tend to be more accurate than its base classifiers.
• Bagging.
• Boosting and Adaptive Boosting.
• Random Forests.
• Probabilistic graphical models, which unlike naive Bayesian classifiers allow the representation of dependencies among subsets of atributes.
• Specify joint conditional probability distributions.
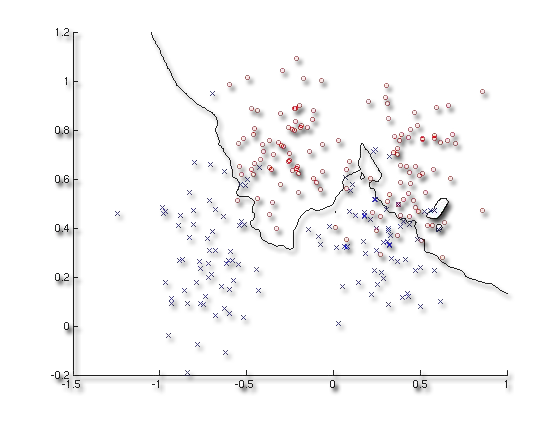
• Consists of an input layer, one or more hidden layers, and an output layer. Each layer is made up of units.
• The inputs pass through the input layer and are then wighted and fed simultaneously to a second layer of ‘neuronlike’ units known as hidden layer. The weighted outputs of the last hidden layer are input to units making up the output layer, which emits the network’s prediction for given tuples.
• Can be used also for unsupervised learning.
• Feedfoward Neural Network.
• Radial basis function network.
• Kohonen self-organizing network.
• Learning vector quantization.
• Recurrent Neural Network.
• Associative Neural Network.
• Self-organizing feature map
• Dynamic neural networks.
• Neuro-fuzzy networks.
• Spiking neural networks.
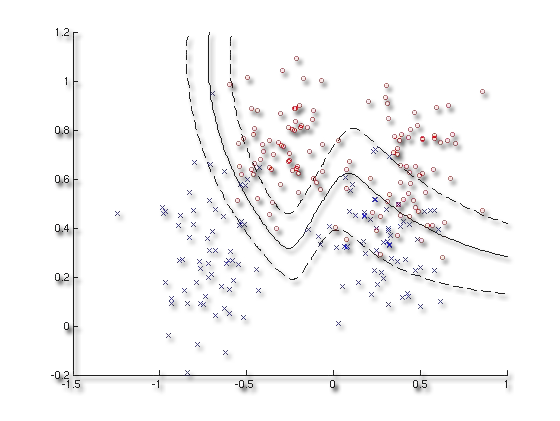
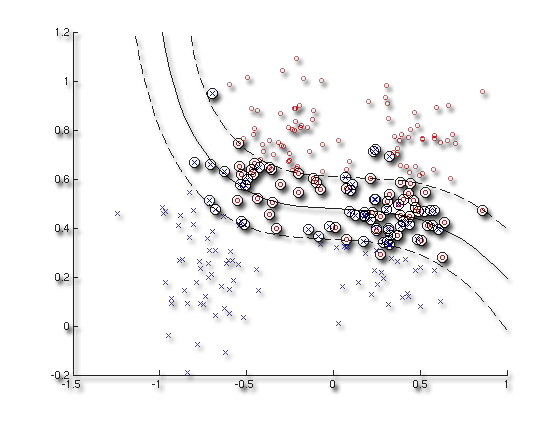
• Models for the clasiffication of both linear and nonlinear data.
• They uses a nonlinear mapping to transform the original training data into a higher dimension. Within this new dimension, they search for the linear optimal separating hyperplane.
• Support various kernel functions as Polynomial kernels of degree h, Gaussian radial basis function kernels or Sigmoid kernels.
• Support custom kernel functions.
• Search for a linear relationship between some explanatory variables and a response variable.
• Support classical linear regression for continuous response and logistic linear regression por nominal response.
• Support more general linear regression models as General Linear Regression or Generalised Linear Regression.
• Support both classical and bayesian approach to linear regression parameters estimation.
• Use all the data to make each prediction, rather than trying to summarize the data first with few parameters.
• Nearest neighbors.
• Locally weighted regression.
• Genetic Algorithms.
• Rough Set Approach: Good for noisy data.
• Fuzzy Set Approaches: Based on Fuzzy Logic Rules.
• Active Learning: Iterative type of supervised learning that is suitable for situations where data are abundant, yet the class lasbels are scarce or expensive to obtain. The learning algortihm is active in that it can purposefully query a user for labels.
• Sentiment Classification: The classification task is to automatically label the data as eithe positive or negative.
Models Reference
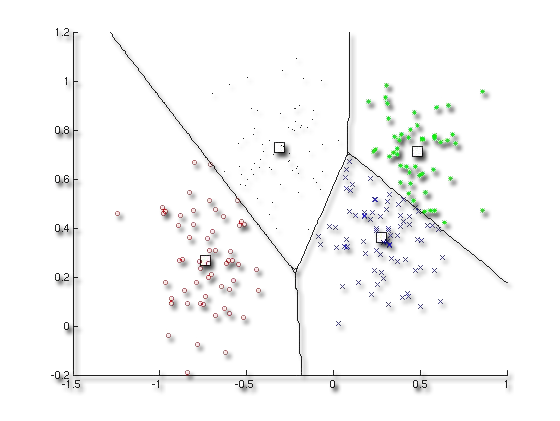
• These models partition a set of data objects into subsets. Each subset is a cluster, such that objects in a cluster are similar to one another, yet dissimilar to objects in other clusters.
• Partitioning methods: Given a set of n objects construct k partitions of the data, where ecah partition represent a cluster and k <=n.
• Hierarchical methods: Create a hierarchical decomposition of the given set of data objects.
• Density-based methods: Their general ideais to continuegrowing a given cluster as long as the density in the neighborhood exceeds some threshold.
• K-Means: A Centroid-Based Technique. Sensitive to outliers.
• K-Medoids: Less sensitive to outiers. Use absolute-error criterion.
• Agglomerative hierarchical clustering method: Starts by letting each object form its own cluster and iteratively merges clusters into larger and larger cluster.
• Divisive hierarchical clustering method: Starts by placing all the objects in one cluster. It then divides the root cluster into several smaller subclusters.
• The representation commonly used is a dendrogram.
• Algorithms: BIRCH, Chamaleon, Probabilistic Hierarchical Clustering that usesprobabilistic models to measure distances between clusters.
• DBSCAN.
• OPTICS.
• DENCLUE.
• Grid-based method: Itquantizes the object space into a finite number of cells that form a grid structure on which all operations for clustering are perfomed. STING and CLIQUE.
• Probabilistic Model-Based Clusters: Assume that a hidden category is a distributionover the data space, which can be matehmatically represented using a probability density function. Expectation-Maximization Algorithm.
• Biclustering Methods.
• Search for recurring relationships in a given data.
• Discover interesting associations and correlations between itemsets in trasactional and relational databases.
• Association Rules: consist of first finding frequent itemsets, from which strong association rules in the form A=>B are generated. These rules also satisfy a minimum confidence threshold.
• Candidate generation, Pattern growth, Vertical format.

Models Reference
• These models become proficient in an unknown evironment, given only its percepts and ocassional rewards.
• Direct Utility Estimation: uses the total, observed reward-to-go for a given state as direct evidence for learning its utility.
• Adaptive dynamic programming: learns a model and a reward function from observations and the uses value or policy iteration to obtain utilities or an optimal policy.
• Temporal-difference methods: update utility estimates to match those of successor states.

Models Reference
• These models become proficient in an unknown evironment, given only its percepts and ocassional rewards.
• Include finding "best available" values of some objective function given a defined domain, including a variety of different types of objective functions and different types of domains.
• Local search methods such as hill climbing and simulated annealing.
• Local search methods apply to problems in continuous spaces: Linear programming and convex optimization.
• Genetic Algorithms.
• Contingent plans for nondeterministic eviroments.
• Online searchfor exploration problems.
• Particle swarm optimization.


Models Reference
• Provides algorithms and tools for the design and simulation of computer vision and video processing systems.
• Feature Detection and Extraction: Enables you to derive a set of feature vectors, also called descriptors, from a set of detected features.
• Registration and Stereo Vision: Estimates the geometric relationships between images or video frames.
• Object Detection, Motion Estimation, and Tracking.
• Audio transcription.
• Probabilistic language models based on n-grams for language identification, spelling correction, genre classification, and named-entity recognition.
• Text classification.
• Speech recognition.
• Syntax analysis.
• Semantic Interpretation.

• Sequence of data points, measured typically at successive points in time spaced at uniform time intervals.
• Time series correlation.
• Forecasting models based on time series.
• Time series classification.
• White Noise.
• Random walks.
• Autoregressive models.
• Fitted models.
• Linear models.
• Generalised least squares.
• Linear models with seasonal variables.
• Harmonic seasonal models.
• Logarithmic transformations.
• Non-linear models.
• Stationary Models: Fitted MA models, ARMA Models.
• Non-Stationary Models: Non-seasonal and seasonal ARIMA models, ARCH models.
• Spectral Analysis.
• Multivariate models.
• State Space Models.

Models Reference
• Asessing how good or how ‘accurate’ your models are.
• Various types of error measure.
• Confusion matrix.
• Misclassification rate.
• Sensitivity and specificity.
• Precision and recall.
• Computational speed.
• Robustness to noisy data.
• Scalibility.
• Interpretability.
• Holdout Method and Random Subsampling
• Cross-Validation
• Bootstrap.
• Model Selection using statistical Tets of Significance.
• Comparing based on Cost-Benefit and ROC Curves.


Contact us and we'll get back to you within 24 hours.
Azafranal, 48-50. 3ºA. 37001 Salamanca. Spain
+34 923 147 250